$5,619ON THE GRAPHIC
“Trump’s tariffs cost each Michigan household… $5,619”@AbdulElSayed on X, 1 September 2026. Graphic text beside photos of Mike Rogers and Donald Trump.[1]
Caption: “Mike Rogers called it ‘necessary.’”
 1 of 4 False
 Fact-check · 4 claims
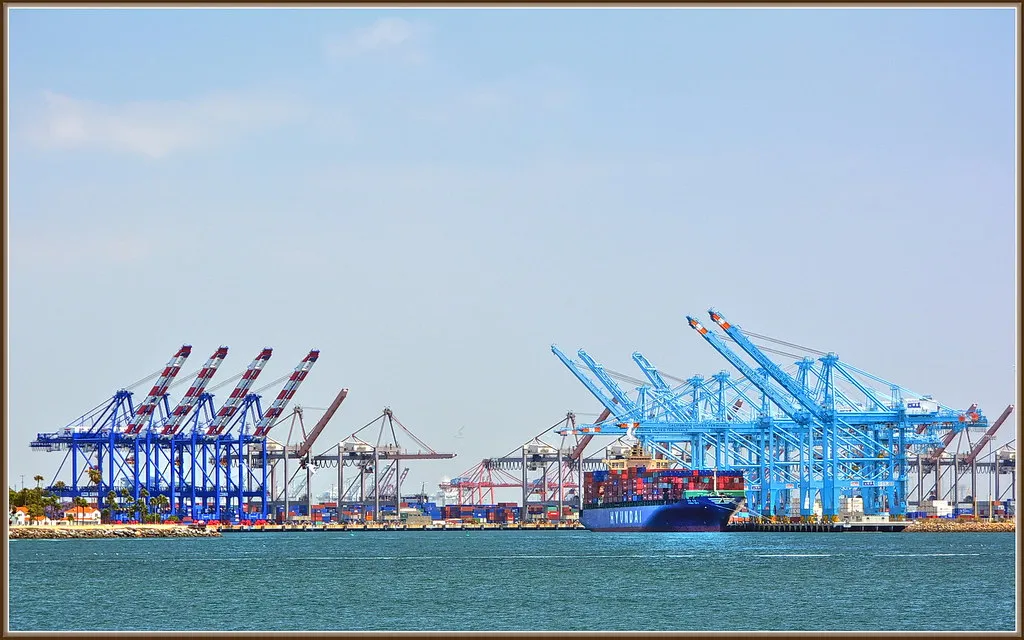
Photo: formulanone / CC BY-SA 2.0 · source
The $5,619 is Michigan importers’ $23.2 billion tariff bill split across the state’s households. The group behind the figure says it is not what each household paid.
By The Crosscheck Desk · 2026-09-24
“Trump’s tariffs cost each Michigan household… $5,619”@AbdulElSayed on X, 1 September 2026. Graphic text beside photos of Mike Rogers and Donald Trump.[1]
Caption: “Mike Rogers called it ‘necessary.’”
The claim appears as text on an image, not in the post’s caption. The graphic gives no time period and no source. PolitiFact rated the claim Mostly False on 17 September.[2] After that story ran, an El-Sayed campaign spokesperson told PolitiFact the figure came from news outlets that had reported it as a per-household cost, and pointed to a 15 September Wall Street Journal column by Gov. Gretchen Whitmer making the same point.[2] We found no later instance of El-Sayed repeating the number, but we did not review his videos or speeches in full.
This check traces the figure to its primary source rather than relying on PolitiFact, and rates two claims the post leaves a reader with.
“Trump’s tariffs cost each Michigan household $5,619”
The figure exists and is copied correctly. It is Michigan importers’ estimated executive tariff bill divided by the number of Michigan households. The group that published it says it is not what each household paid.
“Mike Rogers called it ‘necessary’”
Rogers wrote on 29 August that “tariffs are necessary, but are not a one-size-fits-all solution.” The caption drops the qualifier.
Implied: Michigan households carry a heavier tariff burden than households in any other state
Michigan ranks first of 52 on the per-household version of the importer measure. On a Federal Reserve Board measure of how much of household spending goes to imported consumer goods, it ranks 22nd of 31 states.
Implied: $5,619 is what tariffs cost a Michigan household in a year
The total covers 18 months, January 2025 through June 2026. National estimates that circulate alongside it, such as $1,000 or $1,100 per household, are annual.
The number traces to the National Taxpayers Union Foundation’s State Tariffs Tracker at tariffs.org, last updated 4 August 2026 with data through the second quarter. NTUF is the research and educational affiliate of the National Taxpayers Union, and the estimates were prepared for it by the consulting firm Trade Partnership Worldwide.[3] It is not a Yale Budget Lab, Tax Foundation, Penn Wharton or Joint Economic Committee figure.
The Michigan page says: “Executive tariffs have cost Michigan an estimated $23 billion since January 2025 … For comparison purposes, that’s equivalent to $5,619 per Michigan household.”[3] The tracker’s data file puts the total at $23,212 million.[6] Dividing that by $5,619 gives about 4.13 million households, the Census-based count NTUF says it used.[4]
The figure reached the Senate race through the press. PolitiFact’s article links an Axios story from 27 August, five days before El-Sayed’s post, and later coverage carried the same reading. The Mackinac Center’s Michigan Capitol Confidential ran the headline “Michigan households pay $5,619 in tariffs” on 14 September.[13] Rep. Hillary Scholten, a Michigan Democrat, posted that Michigan families pay “the highest price in the nation” and called the figure “an estimated $5,619 per household.”[14] The misreading is not confined to one party.
NTUF’s methodology page states that the figures “estimate the additional tariff costs paid on imports into each state” and are “not customs receipts attributable to individual taxpayers.”[5] The import is assigned to the state where it enters the supply chain, not the state where the final buyer lives.
| Michigan import category | Extra tariffs since Jan. 2025 | Share of $23.2B |
|---|---|---|
| Cars & trucks | $10.4B | 45% |
| Auto parts | $5.0B | 21.4% |
| Steel, aluminum & other metals | $1.5B | 6.3% |
| Machinery & parts | $0.7B | 2.9% |
Category figures from the NTUF data file.[6] Shares computed from those figures.
NTUF says 64% of Michigan’s total fell on raw materials, parts and equipment that manufacturers buy.[3] Bryan Riley, who directs NTUF’s free trade initiative, told PolitiFact: “For Michigan, a bunch of the cost is paid by manufacturers importing machinery or auto parts. … It is not the amount paid by each household.”[2]
Michigan State University supply chain professor Jason Miller told PolitiFact that Census data lists Michigan as the destination for $10.5 billion of vehicles imported from Canada and $21.5 billion from Mexico, and that those cars are shipped on to buyers across the country. He added that importers absorb part of the cost in lower margins.[2]
Two smaller points about the total. First, it is a gross figure over 18 months, January 2025 through June 2026. Spread evenly, that is about $3,750 a year. Second, the tracker counts all executive tariffs in the period, including ones that predate Trump’s return. In 2024 the same Michigan series ran at about $150 million a month.[6] At that rate, 18 months comes to about $2.7 billion, or 11.6% of the $23.2 billion.
Each estimate below answers a different question, which is why they differ so much. The first two use NTUF’s importer method. The rest try to estimate what households pay through prices or taxes.
NTUF, national. Summing NTUF’s 52 jurisdictions gives $343.5 billion in executive tariffs and about 134 million households, or about $2,563 per household on the same basis.[4] That is our calculation from NTUF’s figures, not a number NTUF publishes. Michigan’s $5,619 is a little over twice that.
Tax Foundation. It estimates the Trump tariffs raised taxes by an average of $1,000 per U.S. household in 2025, before the Supreme Court ruling, and will raise them by $820 in 2026.[8]
Yale Budget Lab. Its 24 August update puts household costs at “about $1,100 annually under current law.”[9]
Midwest Economic Policy Institute. This is the only Michigan-specific household estimate we found. The July 2026 report, written with the University of Illinois’ Project for Middle Class Renewal, puts the average Michigan household’s cost from new 2025 tariffs at $3,158 (about $3,200), against $1,320 nationally.[11] It starts from Yale’s January 2026 estimates, assumes 90% of tariffs pass through to consumers, and weights states by import intensity. Imports equal 24.5% of Michigan’s GDP, the highest of the six states studied.[11] Import intensity is the same channel that inflates NTUF’s Michigan figure, so this estimate probably overstates Michigan’s household share too, though by less.
On 20 February 2026 the Supreme Court struck down the tariffs imposed under the International Emergency Economic Powers Act in Learning Resources, Inc. v. Trump.[8] Importers were owed refunds. By Yahoo Finance’s count of Treasury data, about $166 billion had been refunded as of August.[12] Riley told PolitiFact the NTUF tracker does not subtract refunds.[2]
The ruling probably shrinks Michigan’s figure less than most states’. Its largest categories, vehicles, parts and metals, are covered by Section 232 tariffs, which the Court did not strike. The auto tariffs took effect on 3 April 2025 and the parts tariffs on 3 May 2025.[8] NTUF does not publish a net figure, so the size of the adjustment is unknown. Refunds go to importers of record, not to the households who may have paid higher prices.
El-Sayed’s graphic does not rank Michigan, but the figure usually travels with a ranking. Scholten’s post calls it “the highest price in the nation.”[14]
Compared against: all 50 states, the District of Columbia and Puerto Rico in NTUF’s tracker (per-household equivalent and total), and the 31 states in the Federal Reserve Board’s import share of consumption measure.[4][10]
| Measure | Michigan | Top case | Michigan’s rank |
|---|---|---|---|
| NTUF per-household equivalent | $5,619 | Michigan; 2nd is Georgia, $4,771 | 1 of 52 |
| NTUF total executive tariffs | $23.2B | California, $63B | 3 of 52 |
| Fed: import share of consumer spending | 4.09% | California, 13.79% | 22 of 31 |
Michigan’s per-household figure is 17.8% above Georgia’s, so on NTUF’s measure the “highest” label holds. The Federal Reserve Board note, published 3 September, instead estimates how much of each state’s consumer spending goes to directly imported consumer goods, which is closer to what a household buys.[10] On that measure Michigan sits below the 31-state simple average of 5.6%. PolitiFact attributed this study to the New York Fed. It is a FEDS Note from the Board of Governors.[2][10]
The Fed measure leaves out tariffs on parts and materials that raise the price of goods assembled in the U.S., which matters for an auto state. Neither measure settles Michigan’s rank on household cost. The accurate statement is that Michigan importers pay the most per resident household, while Michigan consumers are not unusually reliant on imported consumer goods.
Rogers, the Republican nominee, issued a statement on 29 August after Trump’s 50% tariffs on Canadian goods. It says: “President Trump is right to put America First – and tariffs are necessary, but are not a one-size-fits-all solution.” The same statement says Michigan deserves a senator who will work with Trump “to broker a trade deal with Canada.”[7] The quote is accurate. The caption leaves out the qualifier, and Rogers was not endorsing the $5,619 figure, which appeared later on El-Sayed’s graphic.
A reader of the graphic is likely to take away two things it does not state outright.
True on NTUF’s per-household importer measure, where Michigan ranks first. Not supported by the Fed consumption measure, where it ranks 22nd of 31. MEPI’s estimate puts Michigan above the national average, but it leans on the same import-intensity channel. No source we found measures household tariff cost by state directly.
The graphic gives no period, and the per-household figures voters usually see from Yale and the Tax Foundation are annual. NTUF’s $5,619 is cumulative across 18 months. Even read as an importer burden, the annual equivalent is about $3,750.
The strongest defense runs like this. Tariffs are paid by Americans, and NTUF says as much.[2] When importers in Michigan pay about $15 billion in extra duties on vehicles and parts, some of that cost falls on Michigan workers and firms through lower margins, fewer hires and weaker investment, not only on car buyers elsewhere. MEPI estimates Michigan lost 12,400 manufacturing jobs to the 2025 tariffs.[11] On that view, $5,619 is a fair way to show how exposed Michigan’s economy is.
We score that argument a 3 of 5 against the verdict. It explains why Michigan is hit harder than most states, and El-Sayed would be on firm ground saying Michigan importers face the highest tariff bill per household in the country. It does not rescue “each Michigan household” paying $5,619. The group that produced the number says it does not measure that, and the cost of a car imported through Michigan and sold in Ohio does not land on a Michigan family. The verdict stays Misleading rather than False because the figure is real, correctly copied, and measures something about Michigan, and part of it does reach Michigan households in ways no one has quantified.
For the Senate race. The broader argument does not depend on $5,619. Every independent estimate we found puts the tariff cost at roughly $1,000 or more per household per year nationally, and MEPI puts Michigan above the national average. El-Sayed can make the affordability case with those. The specific number overstates household cost by counting importer payments on goods consumed nationwide, and the figure has spread through both parties’ messaging and through a free-market outlet.
For state tariff comparisons. Import-based state totals rank states by where goods enter supply chains. That tilts toward states with auto assembly and ports. California, Texas, Michigan and Georgia lead the NTUF totals.[4] Dividing those totals by households turns a supply chain measure into something that reads like a household bill. NTUF labels it “for comparison purposes”; the label did not survive the trip into campaign graphics.
What to watch. NTUF updates the tracker quarterly, so a third-quarter update would push the cumulative Michigan figure higher, and a larger number is likely to circulate before the 3 November election, 40 days from publication. Whether NTUF begins netting out IEEPA refunds would change how far that total should be read as a standing cost. Forecast, not finding: without a published net figure, both campaigns can keep citing gross totals.
A viral banana quote came from a parody account. On the same day, Trump did say trade deficits are money the US loses, a view trade data and tariff research contradict.

Trump’s ‘ripping off,’ ‘$200B subsidy,’ and ‘don’t need Canada’ claims rated alongside Greer’s false Auto Pact history and Canadian counterclaims.

A $5,000 check to every adult, if Republicans keep Congress. Two earlier per-person dividend promises produced no payments. The one that did pay was already funded by Congress.
New Crosscheck fact-checks, every other Monday. Sourced, never spun.