Verdict: Unproven. Case for: Groceries did outrun their historical pace (55 of 100). Case against: The 130% comparison comes apart (90 of 100).
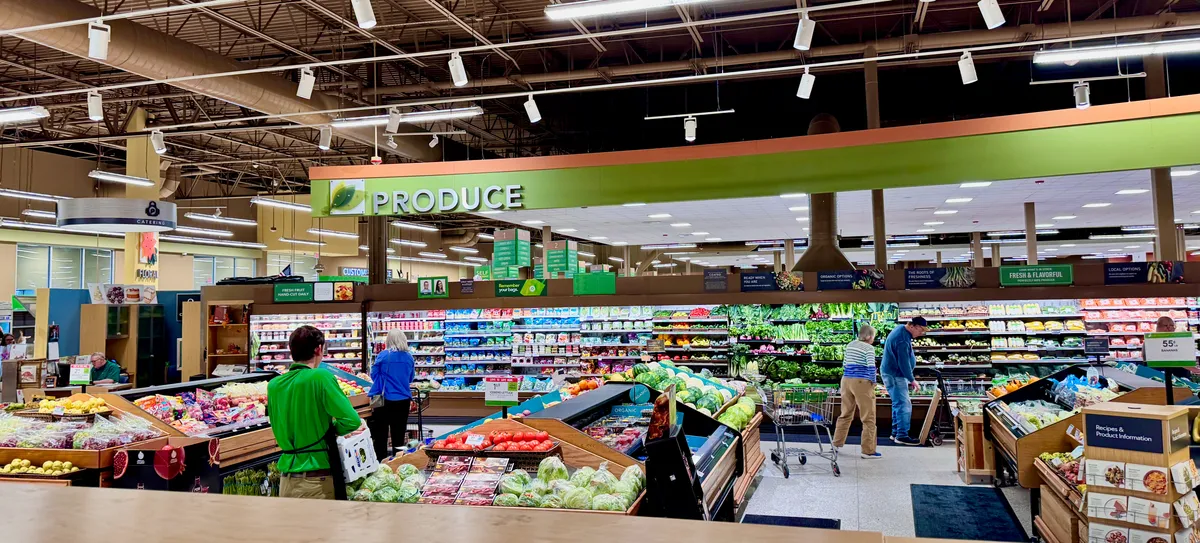
A recurring social-media post shows a grocery order from 2020 next to the same order priced today, with a total that has roughly doubled or worse, and asks how that squares with an official inflation rate of about 3%. One version circulating in July 2026 reported a 28-item Target order at $64.50 in 2020 and $158.30 in 2026, an increase of 145%.[9] Earlier versions used 45 Walmart items and claimed 227%,[10] or a 2006 receipt with 79 items.[11]
The reaction behind these posts is not baseless. Groceries did rise faster than normal, by a lot. But the specific comparison being drawn is broken in a way worth understanding, because the same error keeps producing the same argument.
The three numbers
What can and cannot be checked
These posts are personal anecdotes, not datasets. A basket total depends on which items, which brands, which sizes, which store, and which week, and none of that is published alongside the claim. We looked for a primary post and a receipt for the version quoted above and found neither, only secondary write-ups reporting it.[9]
So the dollar figures rate Unproven. That is not the same as fabricated. Someone may well have paid those amounts. It means there is nothing to audit, and a number nobody can audit cannot carry an argument about national price trends.
What can be checked is everything the claim is compared against, and that is where it comes apart.
The arithmetic is right, and it settles nothing
Take the figures at face value. Going from $68.90 to $158.30 is an increase of $89.40, and $89.40 divided by $68.90 is 129.75%. Rounding that to about 130% is correct, so that piece rates True.
The traceable Target version works out slightly higher: $64.50 to $158.30 is 145.4%.
Correct arithmetic on unverified inputs still tells you nothing about grocery prices. It tells you the poster can divide.
Annual rate against cumulative total
This is the part worth carrying away, and it explains most of the argument.
When a news story says grocery inflation is running near 3%, that is a year-over-year figure: this month against the same month last year. The July 2026 release put food at home at 2.7% over 12 months.[1] It is not a statement about 2020.
The viral posts report a cumulative change stacked across six and a half years. Those two numbers answer different questions, and comparing them directly is the error. A 3% annual rate does not mean prices rose 3% since 2020, any more than a 3% raise each year means your salary is 3% higher after six years.
Stacked up, the annual rates look like this.
| Period | Food at home, 12-month change |
|---|---|
| December 2020 | +3.9% |
| December 2021 | +6.5% |
| December 2022 | +11.8% |
| December 2023 | +1.3% |
| December 2024 | +1.8% |
| December 2025 | +2.4% |
| July 2026 | +2.7% |
Food-at-home inflation peaked at 13.5% in August 2022.[2] The rate has been near or below its long-run average since 2023, which is why current reporting cites a small number. The level never came back down, which is why a shopper still feels 2022.
That also means the "only about 3% since 2020" framing these posts argue against is itself False. Nobody measuring correctly claims that. The viral claim and the strawman it attacks are both wrong, in opposite directions.
The claim that official figures understate grocery inflation rates Misleading: the official figures contain exactly the increase being described, published monthly. What the posts do is compare an annual rate to a six-year total and treat the difference as concealment.
What the data actually shows
We pulled the CPI food-at-home series directly from the Bureau of Labor Statistics time-series archive rather than relying on a summary. Not seasonally adjusted, US city average.[2][15]
January 2020 index: 243.1. July 2026 index: 321.6. That is a cumulative increase of 32.3%, or about 4.40% a year compounded over six and a half years.
Applied to the claim's own starting point, a basket that cost $68.90 in January 2020 would cost about $91.16 today at the national rate, not $158.30. The claim's total sits roughly $67 above what the index supports. For the traceable Target version, $64.50 becomes about $85.34 against a claimed $158.30, which is 85% above the CPI-implied basket.
As a cross-check, the July 2026 release independently reports the same category figures we computed from the raw series: meats, poultry, fish and eggs up 1.9%, cereals and bakery up 2.7%, fruits and vegetables up 5.1%, dairy down 0.5%.[1] Consumer-facing inflation calculators land in the same cumulative range, though the index itself is the authority.[14]
Could a real basket have doubled?
A fair objection: the CPI is an average, and averages hide extremes. Maybe a basket loaded with the worst categories did rise 130%. So we checked every major grocery category over the same window.
| Category | Jan 2020 | Jul 2026 | Cumulative | Latest 12-mo |
|---|---|---|---|---|
| Beef and veal | 313.6 | 522.2 | +66.5% | +9.4% |
| Meats, poultry, fish, eggs | 252.9 | 350.6 | +38.6% | +1.9% |
| Nonalcoholic beverages | 172.3 | 237.4 | +37.8% | +4.1% |
| Poultry | 231.8 | 313.7 | +35.3% | −0.5% |
| Other food at home | 210.8 | 283.8 | +34.7% | +2.5% |
| Cereals and bakery | 275.9 | 369.9 | +34.1% | +2.7% |
| All food at home | 243.1 | 321.6 | +32.3% | +2.7% |
| Eggs | 208.8 | 267.1 | +27.9% | −25.7% |
| Fish and seafood | 300.8 | 380.7 | +26.5% | +7.0% |
| Fruits and vegetables | 301.7 | 369.6 | +22.5% | +5.1% |
| Dairy | 223.0 | 271.3 | +21.7% | −0.5% |
The answer is no, and it is not close. The single worst major category is beef at 66.5%. A basket made entirely of beef would be about half the claimed increase. Every other category lands between 21% and 39%.
Eggs deserve a note, because they are the category people reach for. Eggs did spike: the index hit 504.2 in March 2025, 141.5% above January 2020, on avian influenza.[2] That spike is over. Eggs have fallen 47% from that peak, are down 25.7% year over year, and now sit 27.9% above 2020, below the food-at-home average. USDA forecasts eggs down 30.8% for 2026.[7] An egg-heavy basket would have looked shocking in spring 2025. Today it looks cheap.
So the claim that a real basket could reach 130% on category mix rates False. Something else has to explain the gap.
What usually explains the gap
The mechanism is documented, and it is mundane: re-ordering an old cart substitutes items.
When the 45-item Walmart version circulated, the retailer and commenters traced the inflated total to discontinued products. Items no longer stocked were replaced in the recomputed cart, in some cases by third-party marketplace sellers at much higher prices, which is not a like-for-like comparison.[10] Other people who ran the same exercise reported increases of roughly 20% to 25%, in the neighborhood of the index.[10]
Package size compounds it. A cart re-priced six years later may quietly swap a 64-ounce bottle for a 59-ounce one, or a family size for a standard size, and the total moves without the per-unit price moving as much.
Basket comparisons drawn by public figures get the same treatment and run into the same problem, as with a 2025 claim about Walmart Thanksgiving prices that compared baskets with different item counts.[13]
None of this requires anyone to be lying. It requires only that a shopping cart is not a fixed basket, which is precisely the problem the CPI was designed to solve.
The part of the grievance that holds up
Having said what the claim gets wrong, the underlying complaint is real and the numbers support it.
Food at home rose at about 4.40% a year since January 2020. Its 20-year historical average is 2.6% a year.[7] Groceries have therefore been climbing at roughly 1.69 times their long-run pace.
Put concretely: had food prices tracked their historical norm since January 2020, they would be up about 18.2% rather than 32.3%. That 14-point excess is not a rounding artifact. On a $68.90 basket it is the difference between $81.41 and $91.16, and it recurs every week.
That is the legitimate core of the reaction, and the 2.7% headline does not convey it, because a small current rate says nothing about the level it is measured from. Anyone told that inflation is "back to normal" is hearing something true about the rate and misleading about the total. This claim rates True.
Why the average never matches your receipt
Four reasons, none of which are concealment.
The index is not about you. BLS is explicit: "The CPI does not necessarily measure your own experience with price change," because the market basket reflects "the experience of the relevant average household, not of any specific family or individual."[3] A household buying beef weekly and no eggs experienced something far above 32.3%. The claim that CPI is meant to match one household's bill rates False.
Shrinkflation is counted, and BLS publishes a series to measure it. When a package shrinks, the CPI treats it as a price increase rather than a flat price. The FAQ gives the example directly: a 64-ounce container of orange juice replaced by a 59-ounce container triggers either a new item selection or a recorded quality change.[3] Beyond that, BLS maintains a research index, the R-CPI-SC, that recomputes inflation while imputing price change in the month a size change occurs, covering food at home back to December 2014 and updated quarterly.[4] BLS itself cautions the research series carries larger measurement error than the official index, and that the CPI sample was not designed to measure downsizing frequency.[4] Researchers continue to argue the adjustment is incomplete.[8][12] Accounted for, imperfectly, and openly studied.
Region matters, modestly. Food at home rose 3.5% over 12 months in the Northeast against 2.3% in the South, with the national figure at 2.7%.[6][5] A real spread, and about 1.2 percentage points wide. It moves a 32% cumulative figure by a few points, not to 130%.
The same dollars land differently. An extra $22 a week on groceries is a different event for a household spending $150 a week than for one spending $400. The percentage is identical; the experience is not. The viral posts do not make this argument, but it is a large part of why the aggregate feels wrong to the people it describes least well.
The verdicts
| Claim | Rating |
|---|---|
| A 30-item basket went from $68.90 to $158.30 | Unproven |
| That is about 130% | True |
| Groceries rose only about 3% since 2020 | False |
| Official figures understate grocery inflation | Misleading |
| Cumulative food-at-home inflation was about 32% | True |
| Category mix could produce 130% | False |
| Groceries outran their historical pace | True |
| CPI should match your grocery bill | False |
The short version: groceries are up about a third since 2020, at nearly 1.7 times their normal pace, and that is bad enough without doubling it. The 3% figure is real but answers a different question, and treating the difference as a cover-up gets the arithmetic and the grievance both wrong.
Living fact-check · does this still hold?
- Baseline
CPI food at home stands at 243.1. Every viral before-and-after post since has used some version of this starting point.
source · s2
- The spike
Year-over-year food-at-home inflation hits its highest rate of the period. This is the year that built most of the cumulative increase.
source · s2
- Normalizing
Food-at-home inflation drops below its own 20-year average. Prices stop climbing quickly, but they do not come back down.
source · s2
- Eggs
Avian influenza drives the egg index to 504.2 against a January 2020 level of 208.8. Eggs have since fallen 47% from that peak.
source · s2
- Viral
A post reporting an order that cost $64.50 in 2020 and $158.30 in 2026 is amplified to a claimed million views. No receipt or primary post was located.
source · s9
- Latest data
Food at home up 2.7% over 12 months and down 0.1% for the month. All items up 3.4%.
source · s1
- Forecast
The Economic Research Service forecasts food-at-home prices up 2.5% for the year, against a 20-year historical average of 2.6%.
source · s7
Sources
- Consumer Price Index Summary, July 2026 — Bureau of Labor Statistics
- CPI time series, US food and beverage (cu.data.11.USFoodBeverage) — Bureau of Labor Statistics
- Consumer Price Index Frequently Asked Questions — Bureau of Labor Statistics
- Research CPI Without Product Size Changes (R-CPI-SC) — Bureau of Labor Statistics
- Consumer Price Index, South Region, July 2026 — Bureau of Labor Statistics
- Consumer Price Index, Northeast Region, July 2026 — Bureau of Labor Statistics
- Food Price Outlook, Summary Findings — USDA Economic Research Service
- Beyond Inflation Numbers: Shrinkflation and Skimpflation — Federal Reserve Bank of St. Louis
- A 28 Item Grocery Order From Target That Cost $64.50 In 2020 Is Now $158.30 In 2026 — The Economic Collapse Blog
- Viral TikTok video claims Walmart grocery prices have skyrocketed — FOX 5 Atlanta
- Viral 2006 grocery receipt reveals 20-year price inflation — WFLA
- Assessing and improving the accuracy of the CPI — BLS Monthly Labor Review
- Walmart Thanksgiving grocery prices claim — PolitiFact
- American Inflation Calculator — American Inflation Calculator
- CPI Home — Bureau of Labor Statistics